

GPLin 0.0.1-pre5 released - 2009-01-26
Here's another preview of GPLin - with just a hint of useful functionality starting to emerge!
 GPlin-0.0.1-pre5.tar.gz
The GUI is pretty much unchanged from the previous release, but under the hood there is now support for building correction curves directly from the .ti3 file created when the linearization testchart is read. The interpolation and inversion of the correction curves is done using the RSPL library from ArgyllCMS, which was written by Graeme Gill and is distributed under the terms of the GNU General Public Licence, V3.
Here's a rough step-by-step guide to using GPLin in its current form:
Having built with the usual ./configure && make commands:
- At the shell prompt, type: ./gplin
- Enter a filename for the project on the first page of the user interface
- On the second page, choose your printer queue and preferred settings. I would recommend the following:
- On the first pane, set Channels to Composite CMYK. (Raw printer channels works, but is of limited use in the absence of software to perfom DeviceN profiling)
- Colour Correction should be set to "Raw". This disables all of Gutenprint's own ink limiting and linearization, leaving everything to GPLin.
- On the next page, choose a suitable starting density - and print a Density Evaluation strip, Err on the side of caution when choosing the starting density - if this is too high you stand a good chance of flooding the inside of your printer with ink! On my R285 at 1440x1440dpi on lightweight inkjet paper, 0.25 is about right. Note also that if you're going to use a total ink limit when profiling of 200% you need to reduce this density to 50%. If you want to use an ink limit of 300%, reduce it to 33%, and so on. I'm currently looking at ways of solving this problem.
- The next page, choosing a suitable base gamma, isn't crticial in terms of accuracy - it simply improves the distribution of the test patches at the linearization stage.
- Next is the Test Chart Generation step - where you choose the number of patches per channel.
- Finally, printing the page(s) of test patches.
That's as far as the main GPLin utility can go, currently. The next stage is to read in the testchart using Argyll's chartread command. This step has to be done manually at the moment. The needed .ti1 and .ti2 files will be found in the <projectname>_temp/ directory.
Once you have a .ti3 file from ChartRead, you can use gplin_graph to view a plot of the printer's response, which will hopefully look something like this:
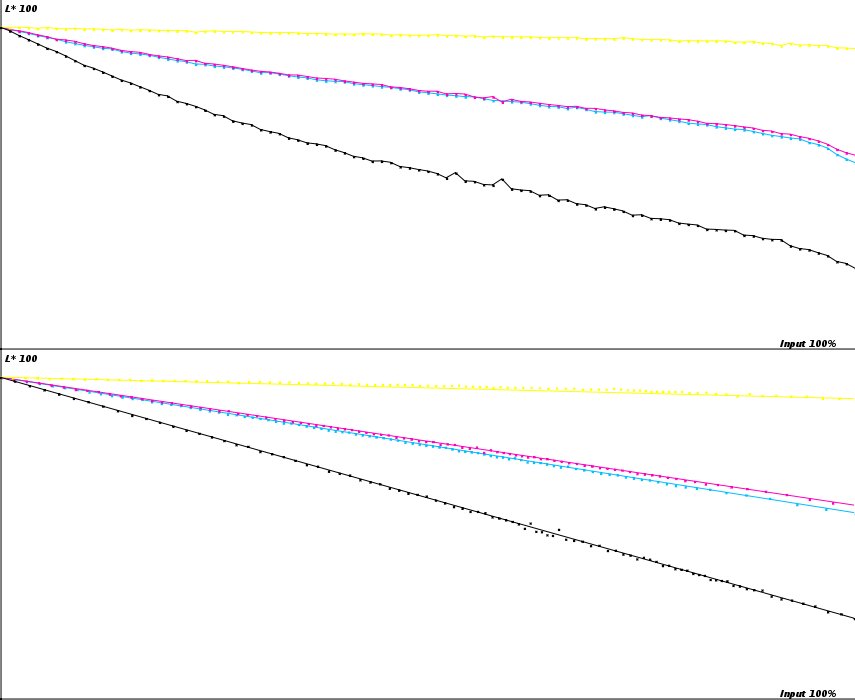
Epson Photo Quality Inkjet Paper, CMYK mode.
The upper plot shows the raw channel response - input vs. L*. The lower plot shows a straight line for each colour, along with the original points with their positions adjusted to show how well or how badly the linearization fits them. Note that the Yellow points fit the line less well because the yellow correction is calculated against b, rather than L*.
Finally, there's a third utility provided with GPLin, called "printdevicen". This can be used to print CMYK or DeviceN images using the linearization curves from a GPLin project.
To use it, simply invoke from the command line with:
./printdevicen -p <projectname>.gplin filename.tif [filename.tif ...]
Printdevicen will automatically find and use the .ti3 file to generate correction curves.
